Widgets
We offer a range of interactive data widgets that clearly visualize the relevant information for you.
The service provides information about “Points of Interest” in the area. The range and the preferred mode of transport can be selected by the user. Supermarkets, services, bus stops, parks, etc. are displayed in suitable categories with the option of analyzing them in detail.
Contact us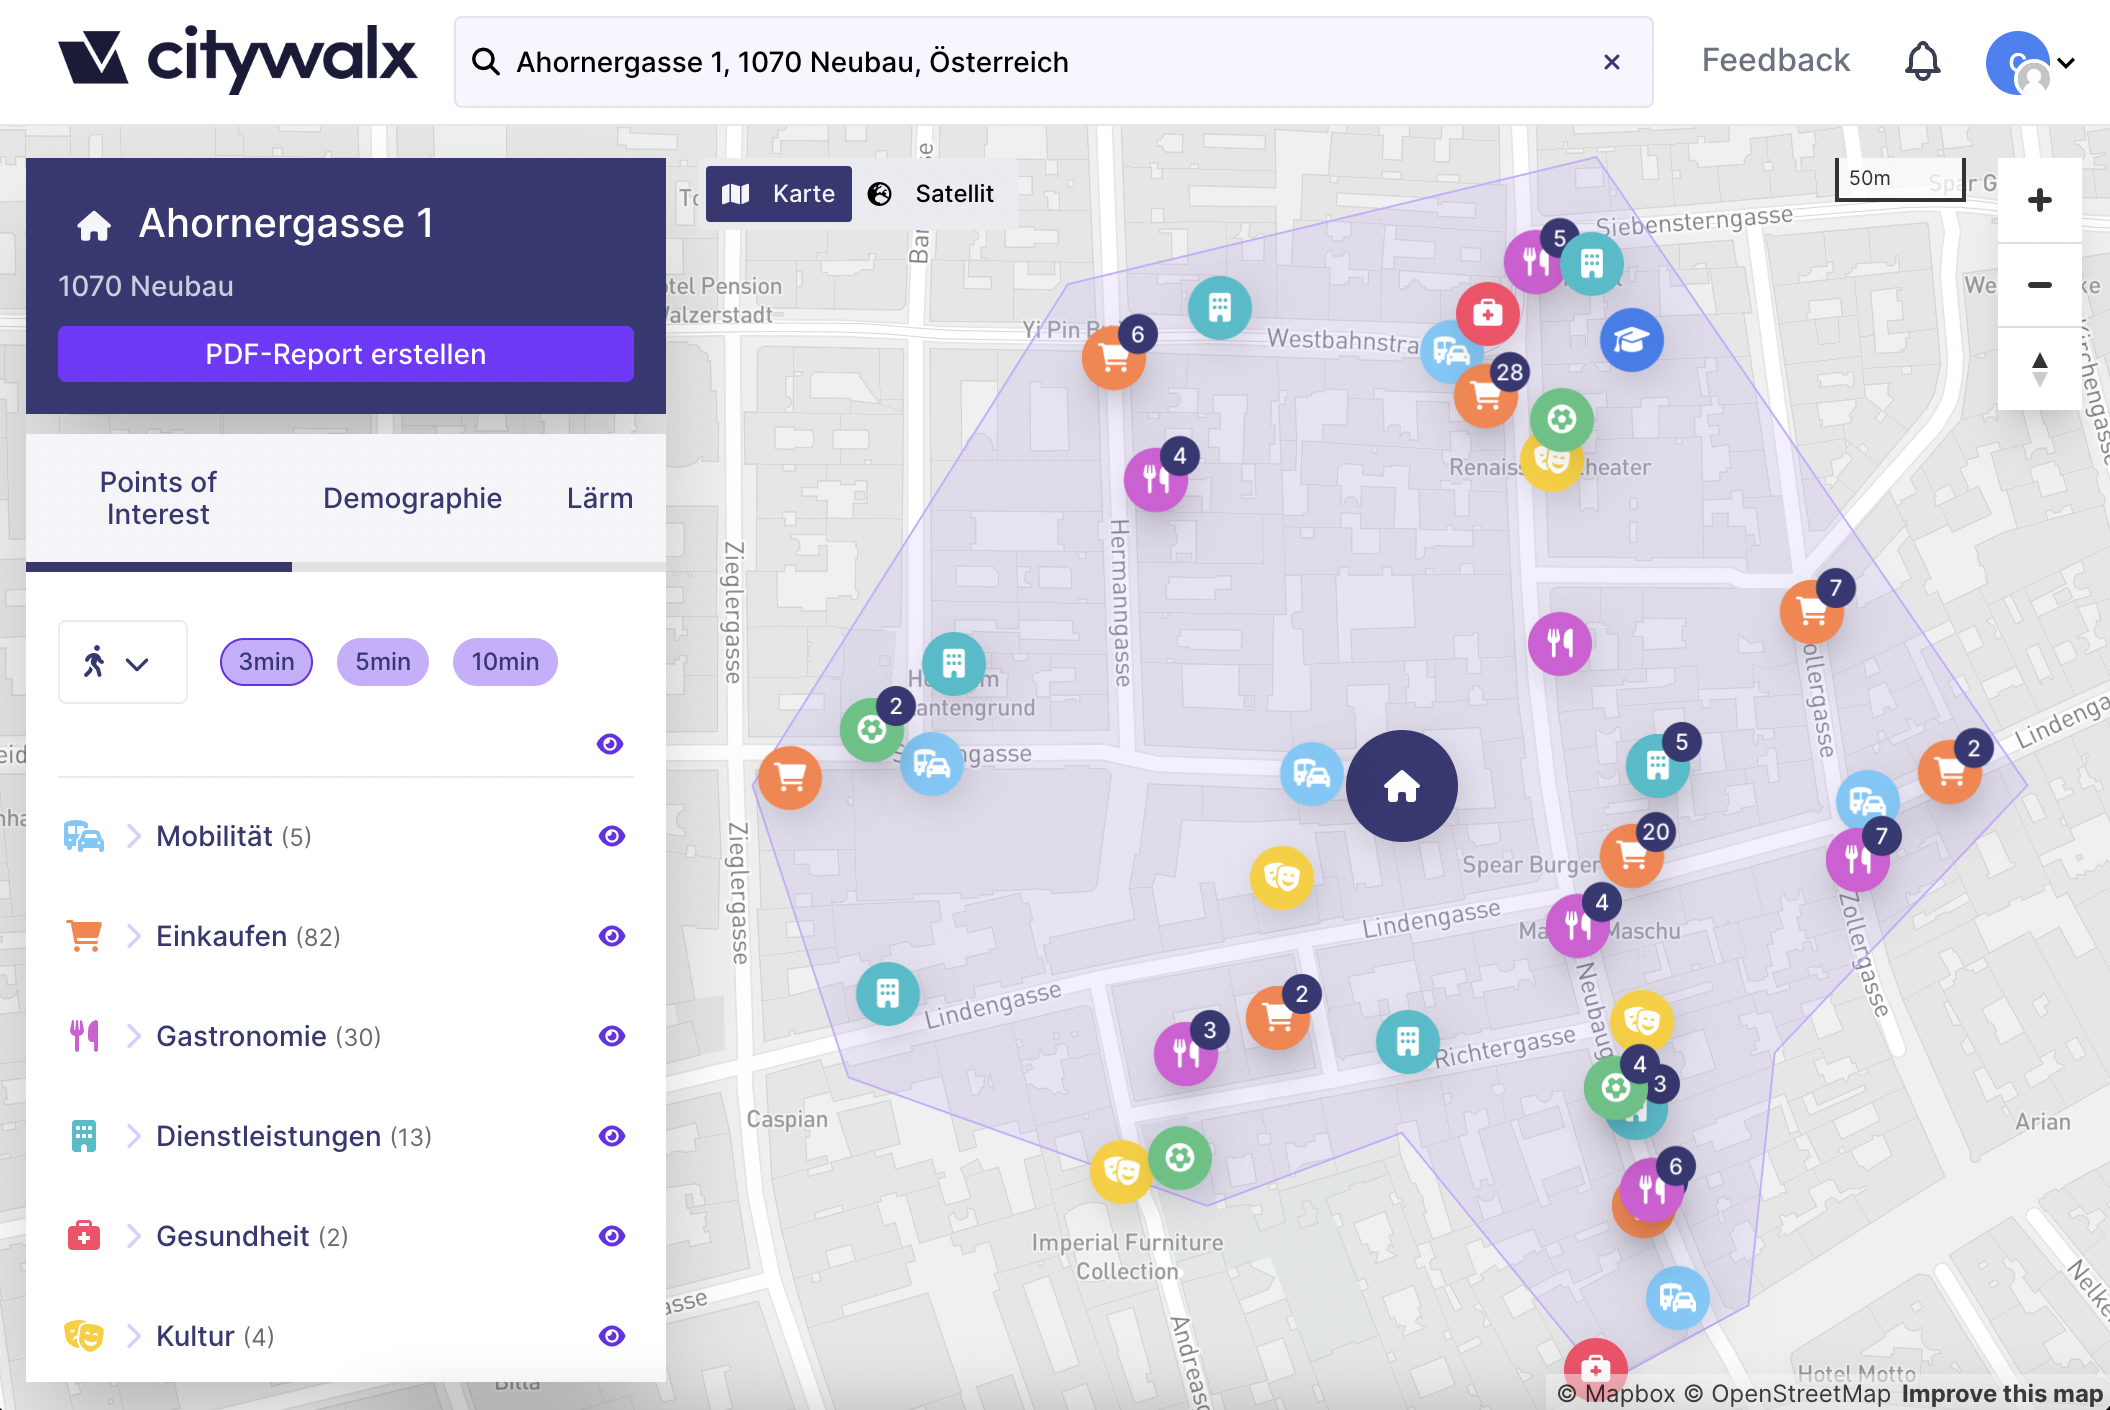
Data on the number of inhabitants, population density, average age, income and education level are available for a wide range of reference areas. In the interface, it is possible to compare and evaluate different areas with each other.
Contact us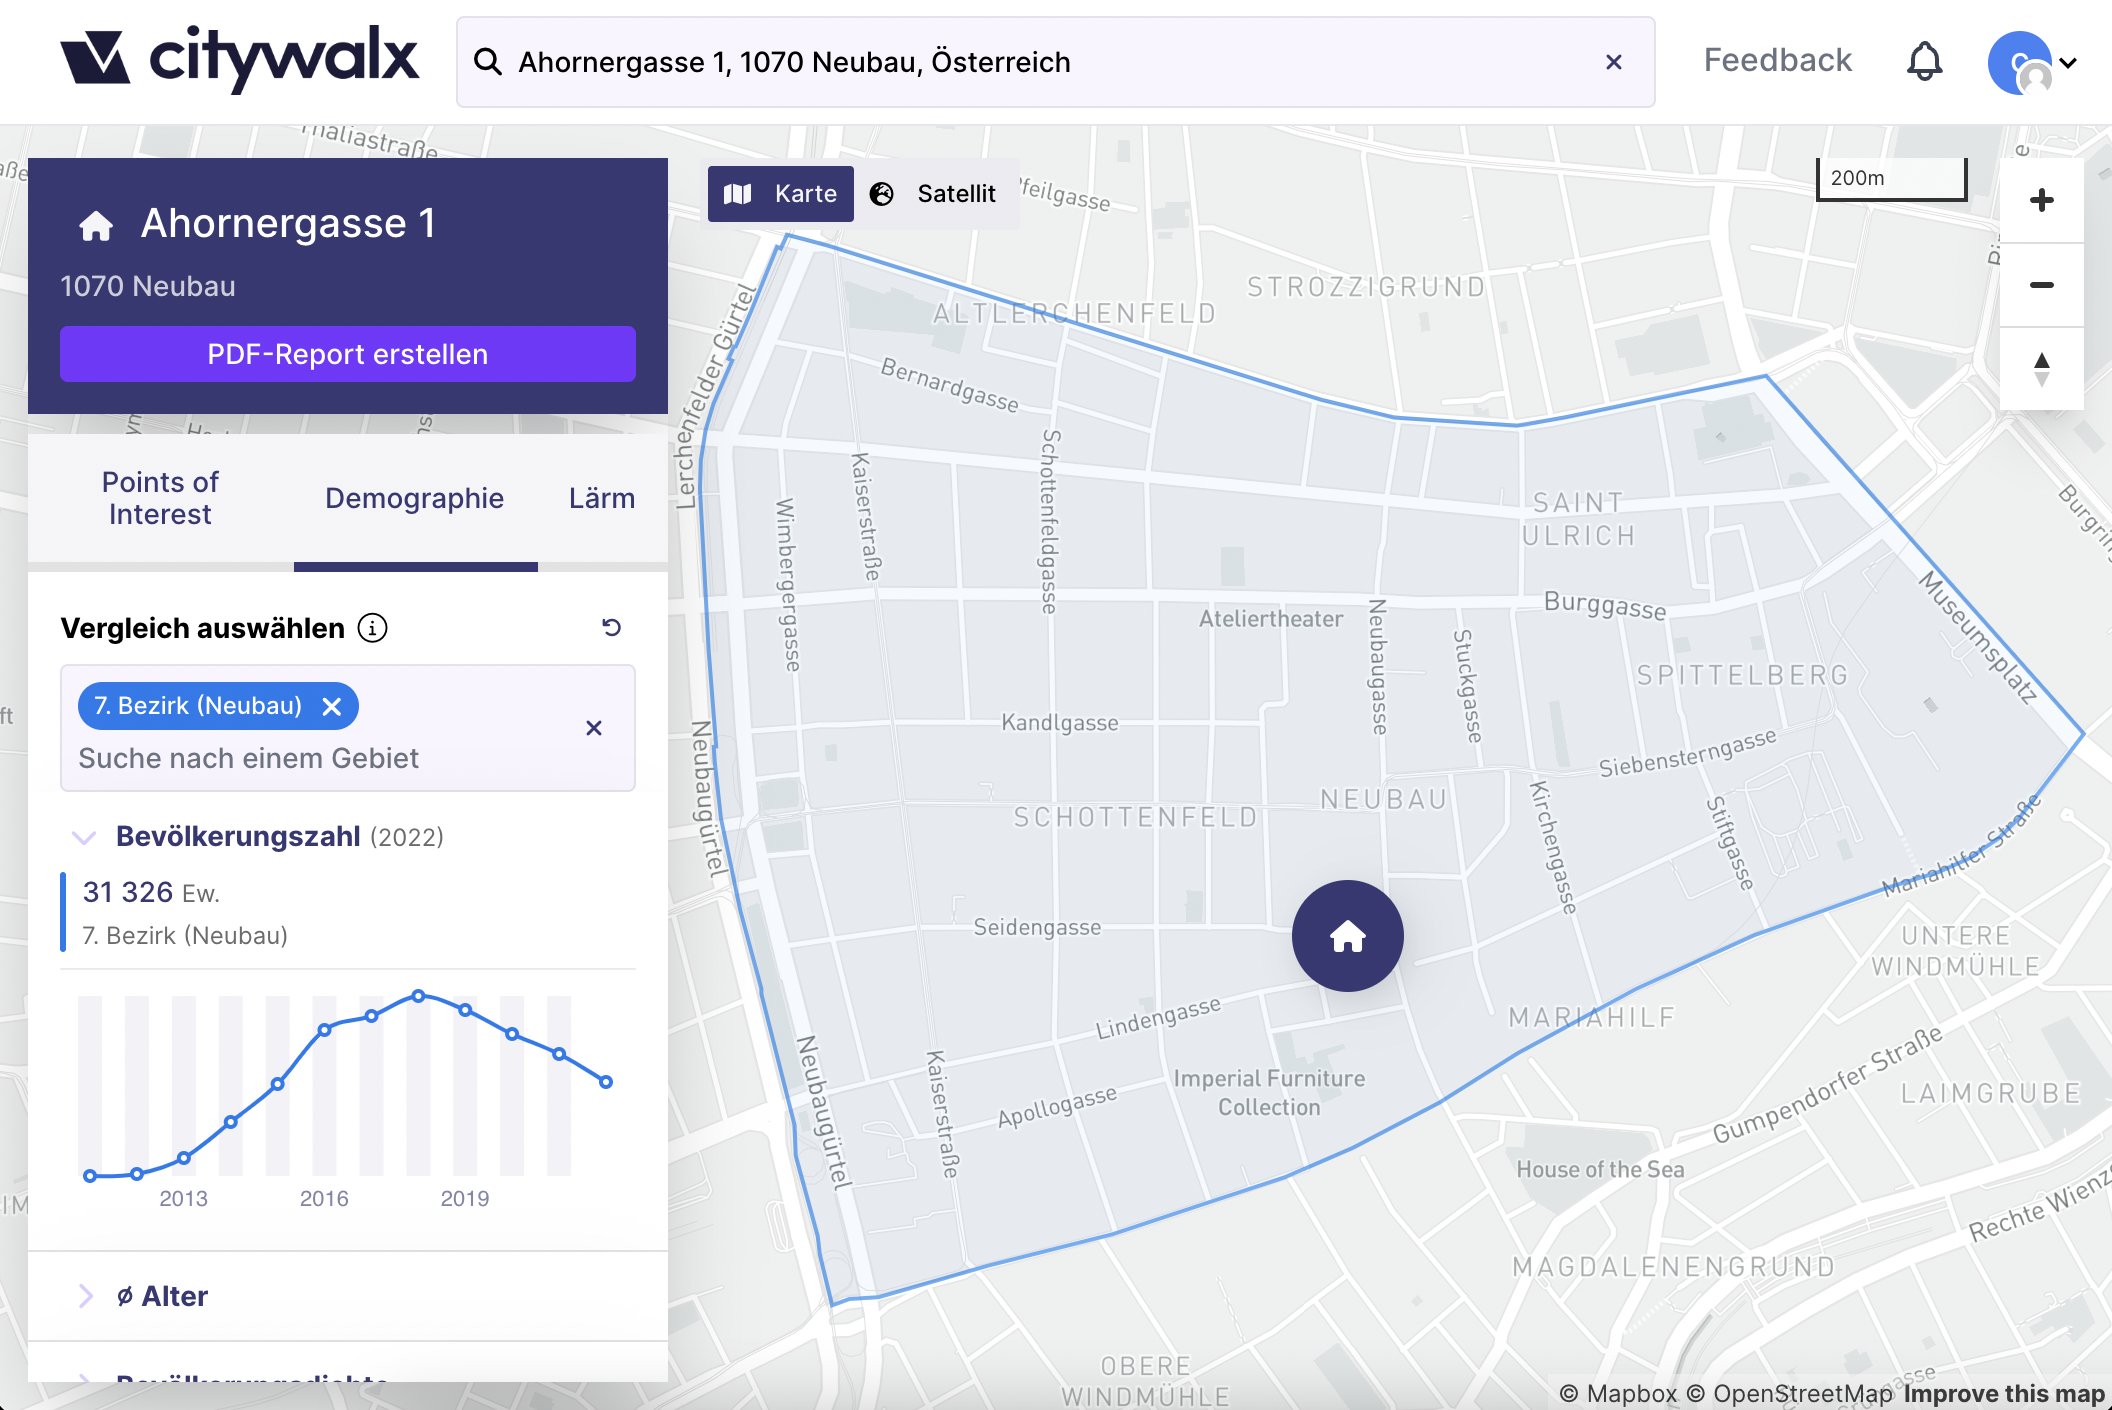
You can query the noise pollution at the location. It is possible to choose between different noise sources or to view the noise during the day or night.
Contact us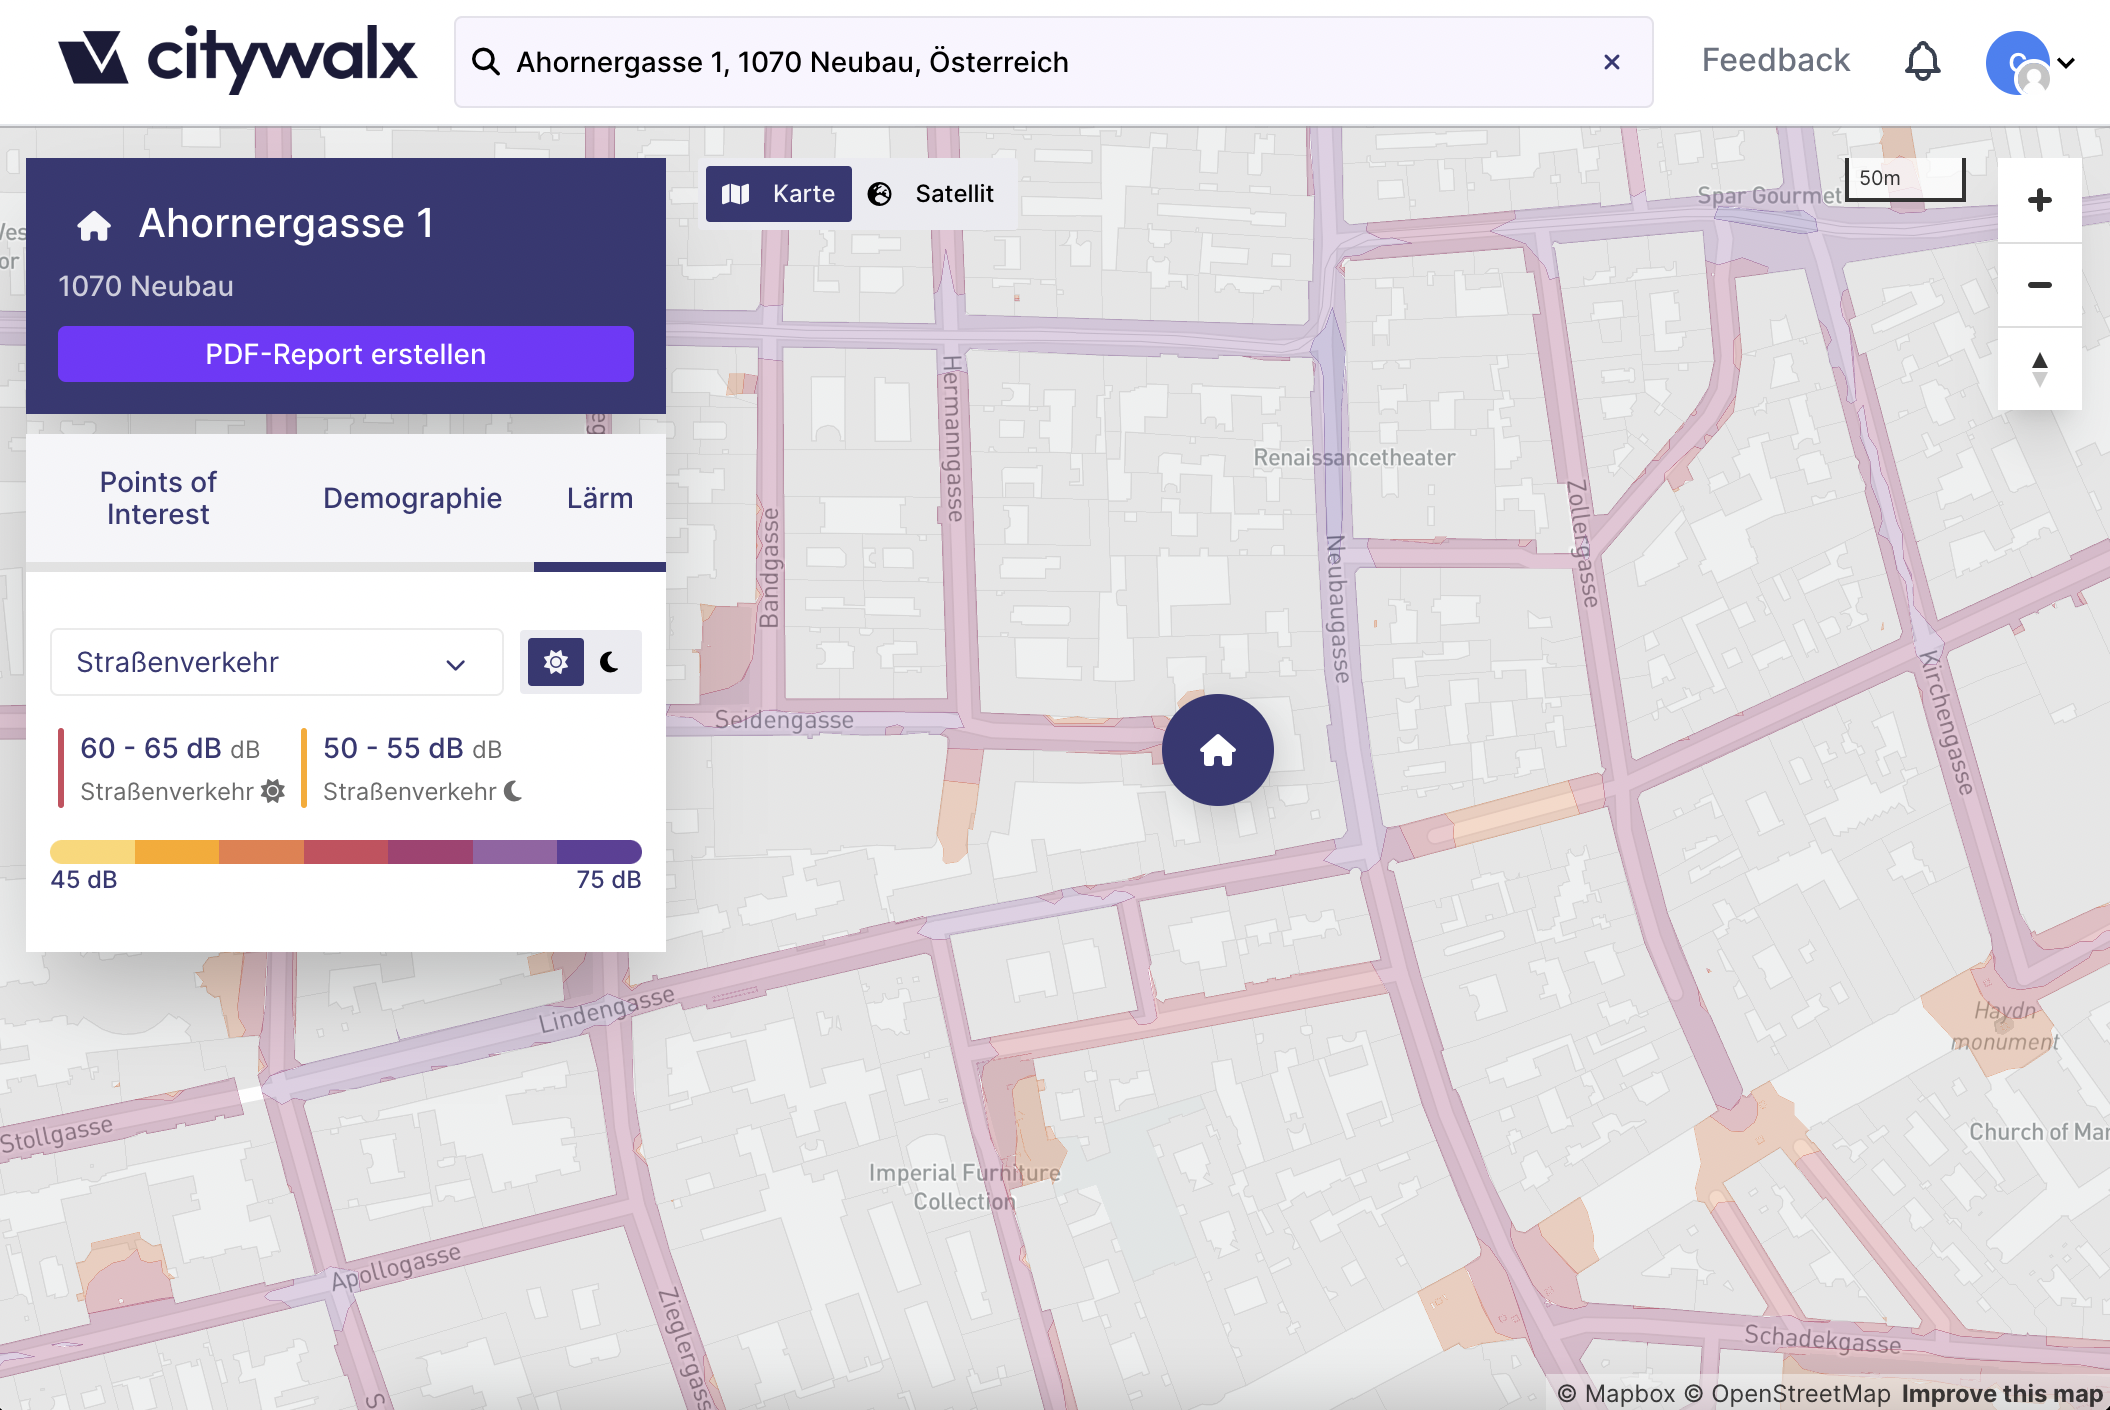
The service offers a PDF export. Here you can output a PDF document with just one click. The contents of the document can be taken from a preset or configured manually in the export settings. You can brand the document with your own logo. There is also the option to share the interface as a public link.
Contact us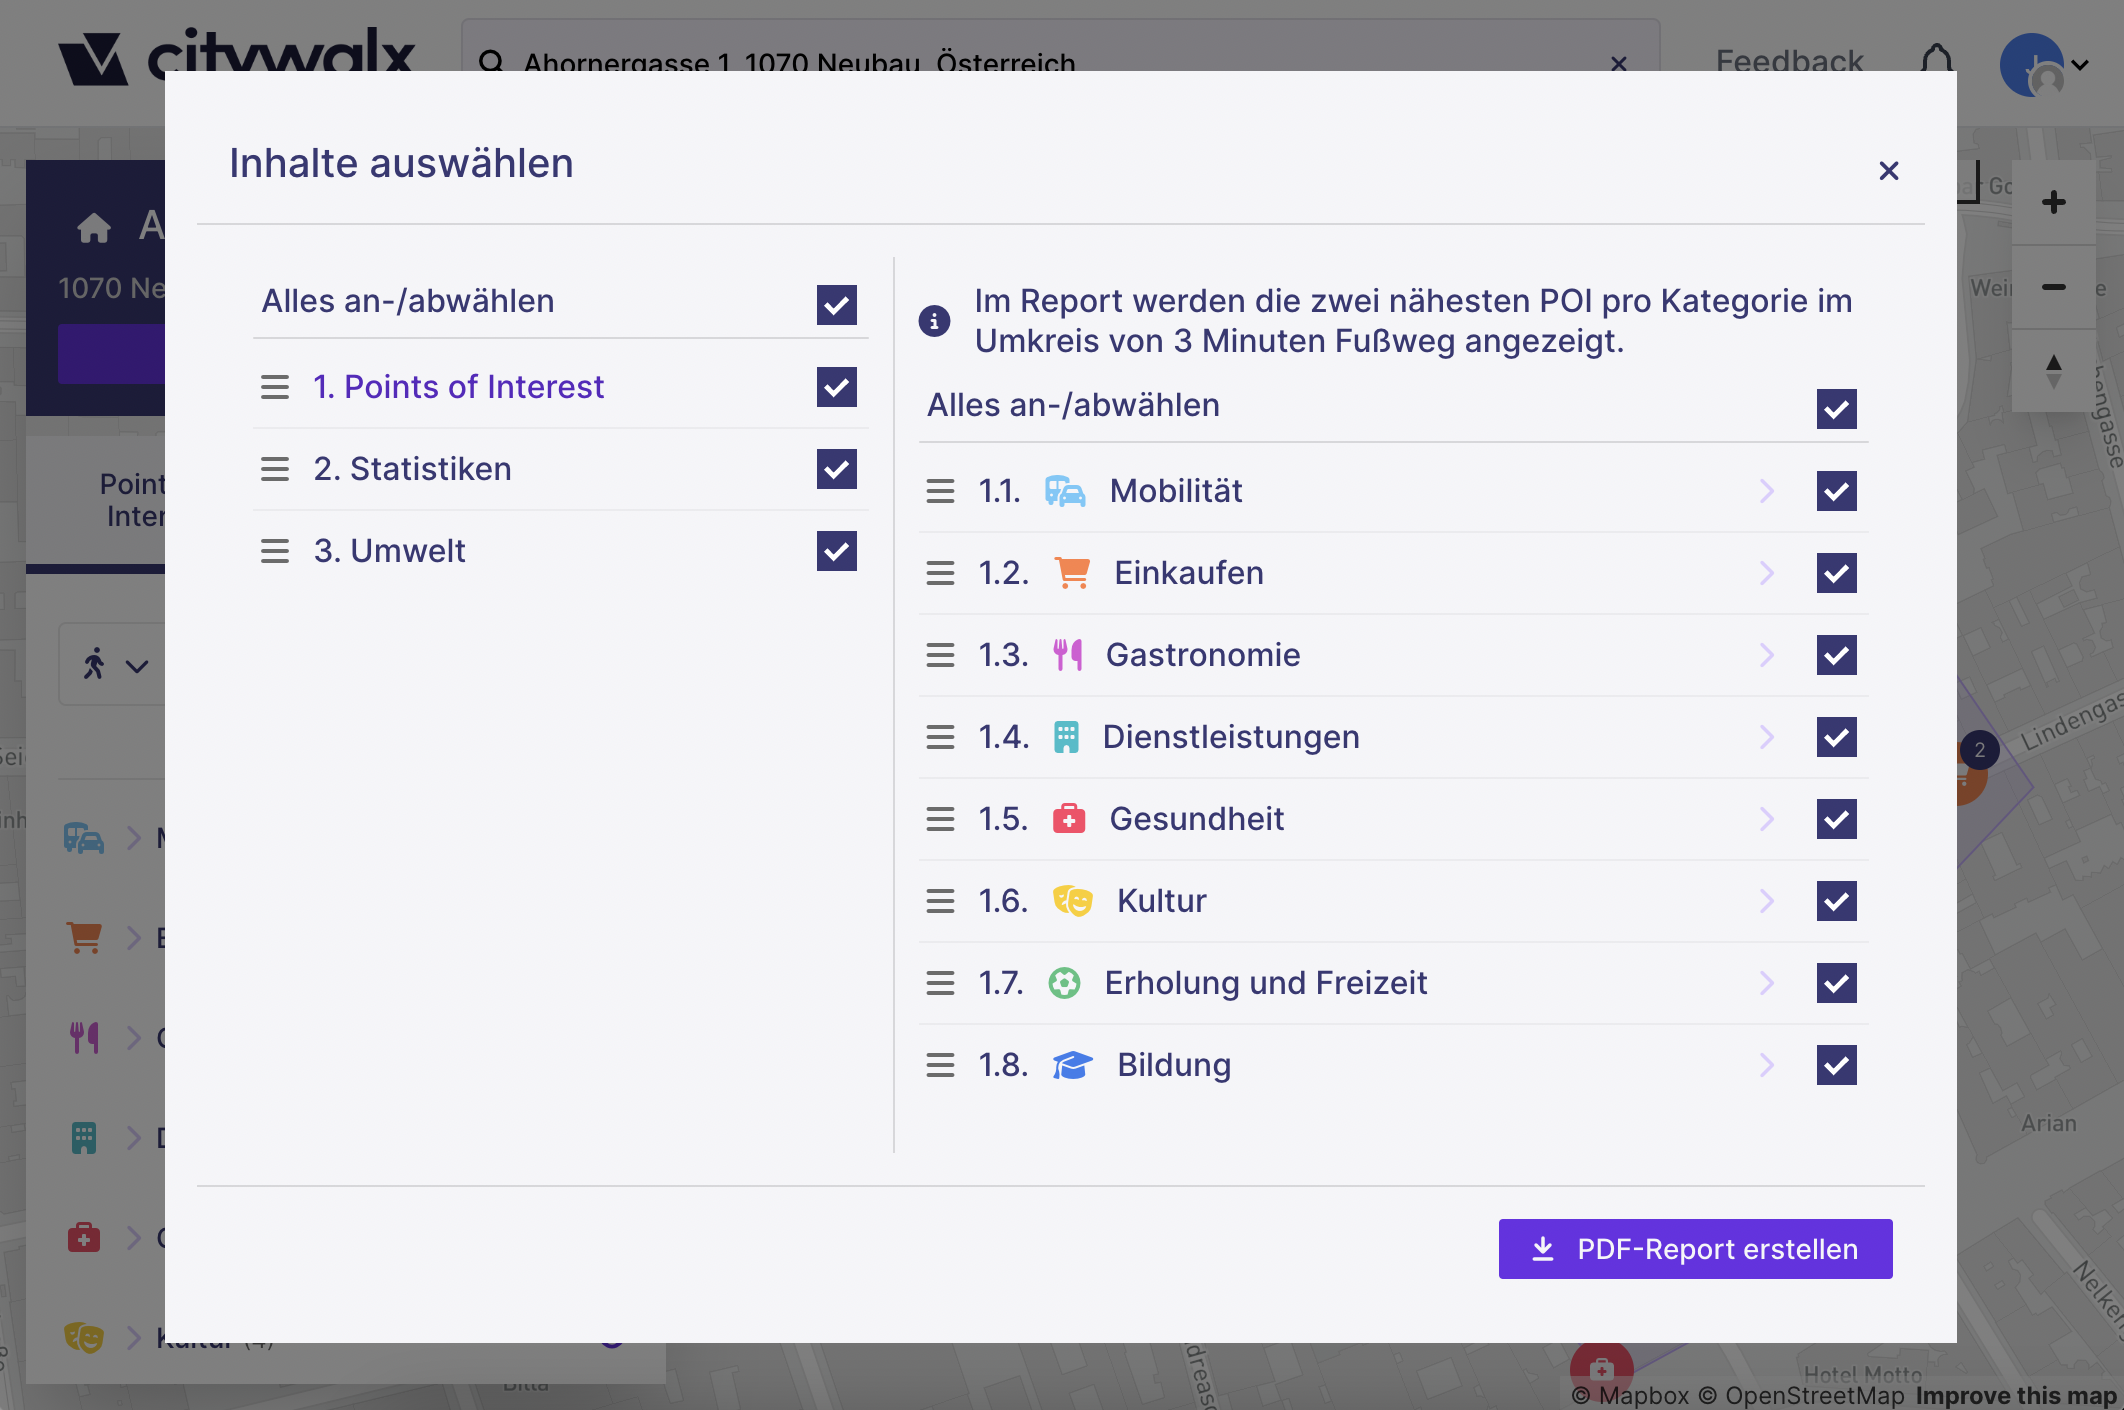
Widget pipeline
With the help of feedback from our partners, we are constantly developing new solutions.
-
Points of Interest
- Mobility
- Shopping
- Gastronomy
- Healthcare
- Education and Culture
- Recreation and Leisure
-
Noise
- Noise level
- Noise sources
- Noise by day / night
-
Statistics
- Demography
- Socio-economy
- Politics
-
Prices (in dev.)
- Purchase prices
- Rental prices
- Energy prices
-
Building details (in dev.)
- Building metrics
- Building dimensions
- Typology
- Renovation status
-
Mobility (in dev.)
- Public transport
- Walk and cycle paths
- Micromobility
- Route determination
-
Environment (in dev.)
- Solar potential
- Air pollution
- Surface sealing
- Green spaces
- Protection zones
-
Climate (in dev.)
- Rain and snowfall
- Sunshine hours
- Air temperature
- Air humidity
- Altitude
-
Zoning (in dev.)
- Display of the zoning plan
You have the following options to use our service:
-
Browser tool
Get access to our easy-to-use web application and customize your content. With the export function you can organize your results clearly in a PDF.
-
Plug in
Integrate individual components of our interface into your own website. You are free to choose what content you want to show and what design the user interface should have.
-
Api integration
Link our datasets to your own system. Configure your individual API access for needs-based integration into your product.